Help videos
Help videos for the ProRealTime platform
First steps with ProRealTime
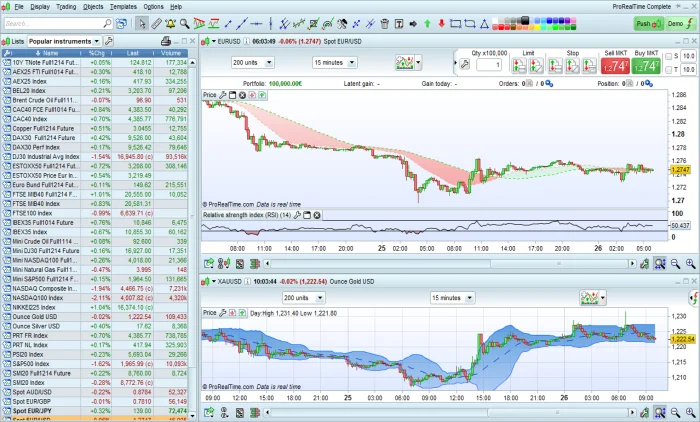
First steps with ProRealTime
Learn all the basics in a few minutes: display an instrument, change the timeframe, setup indicators, draw trendlines, place orders ...
Learn more
Link your charts
Link your charts to create groups that display the same instrument, or the same timeframe, or the same historical data period.
Learn more
Create and import workspaces
Create and import multiple workspaces and quickly switch from one to the other.
Learn moreTrading
Trade from your charts with ProRealTime
Discover how to place manage your orders directly from your charts on the ProRealTime Complete version.
Learn more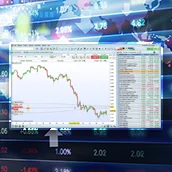
Money Management to improve your trading
Tools to help you respect your Money Management rules: order size adjusted to your risk level, partial entries and exits, customizable trading restrictions...
Learn more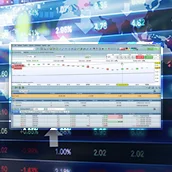
Backtesting and automated trading
Create a trading system in just a few clicks, backtest it on past data, analyze and optimize its results, and run it in automatic trading mode.
Learn more
Trade from the order book
Place orders easily from the order book and track the market depth with many tools, including Order Flow charts.
Learn more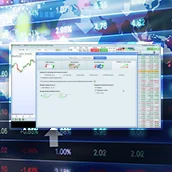
Market replay
Replay the market to practice trading on past data, on any instrument, for any time period.
Learn more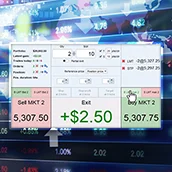
Scalping mode order book
Trade faster and with more precision with our fully customizable scalping interface.
Learn more
FAQ about Automatic Trading and Backtesting
Learn more about Backtesting, AutoTrading safeguards and get programming tips.
Learn moreDrawing tools and cursor
Create and use custom objects
Add custom objects to your drawing toolbar or keyboard shortcuts for faster use.
Learn more
Create multiple chart studies
Create multiple chart studies to have separate sets of objects on your charts. Move or copy objects between chart studies.
Learn moreMarket scanning tools
ProScreener: real-time stock screener
Scans thousands of stocks across several stock markets in a matter of seconds to find securities that match your investment criteria.
Learn moreOther advanced tools
Create your own indicators
Learn how to program and display custom technical indicators on your charts using ProBuilder, a simple programming language created by ProRealTime.
Learn more
Custom spreads and indices
Create custom spreads, indices or more advanced calculated instruments. These instruments can then be displayed on your charts just like any other financial instrument.
Learn more